Arithmetic Return and Geometric Return
In the previous article we saw the calculation of the return on investment for a period and also some important definitions such as the case of arithmetic and geometric returns and also the simple and compound capitalization regimes.
Now let's look at calculating the return for multiple investment periods. We want to calculate the cumulative return on the portfolio and then the average return on the portfolio.
Total return over multiple periods
When we have returns for multiple periods, it is necessary to aggregate all these returns in a measure of accumulated return that is simpler and more effective for the purposes of comparison, analysis and performance evaluation.
There are several ways to aggregate returns. In this article we will analyze two forms: arithmetic return and geometric return.
The arithmetic average return
The arithmetic average corresponds to the sum of linear returns (linear scale) observed, dividing the result by the number of observations. If we have 5 periods of returns, we add those returns and then divide the result by 5.
This is the simplest way to calculate the average return on a portfolio over multiple periods.
Let's imagine that we have the following series of 4 annual returns: -50%, +35%, +21% and +10%. To find the annual arithmetic average, just add the returns and divide by 4 = 4% (see table below).
The geometric average return
The arithmetic average return assumes that the amount invested at the beginning of each year is the same. However, we know that this is not the case, especially in an investment portfolio with financial assets. In a portfolio, even without reinforcements or withdrawals, the truth is that the base value changes every year (if the period under analysis is annual). With the geometric mean, these results will be added to the amounts invested at the beginning of the following year, creating the compound capitalization effect.
The return of the geometric average thus provides a more accurate assessment of the growth in the value of the portfolio in a given period of time.
Taking into account the example above, ((1 - 50%) x (1 + 35%) x (1 + 21%) x (1 + 10%)) ^ (1/4) – 1 = -2.6% . Using a spreadsheet is much simpler and faster.
The geometric return is less than the arithmetic return because the geometric returns capitalize at a lower rate to arrive at the same final location or value. In this example it is even negative, unlike the arithmetic return.
In the table below we can analyze the example in detail:
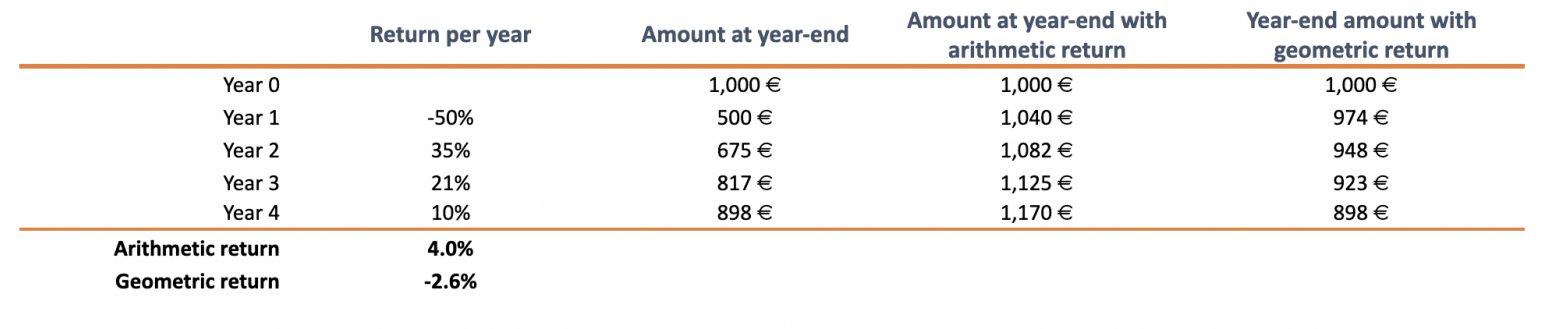
As we can see, the return on the geometric average perfectly represents the effective return on investment. The arithmetic return, despite the investor having reached the end of year 4 with a portfolio value lower than the value initially invested, had a positive return of 4%, which is clearly inconsistent with the final result of the investment.
Note that the periodic return calculation is the basis for calculating the accumulated and average return of the portfolio, by applying the arithmetic and geometric average methods.
Which method should we choose: the return with arithmetic average or with geometric average?
Given these results, it is important to know which method to use and in which situations we can or should use it.
If we are analyzing the return of a series of periods with an investment portfolio composed of guaranteed equity and income instruments and with no or low volatility, we can use the return based on the arithmetic average. Under these conditions, and without having negative periodic returns, the arithmetic average returns become easier to calculate and produce correct results.
If we are analyzing the future, namely in terms of risk and expected returns, it is best to use the arithmetic return, as we do not know when we will have negative or positive returns.
However, in order to evaluate the effective return of a portfolio subject to variations and with periodic negative returns, the best metric is undoubtedly the geometric average return, as it takes into account the capitalization effect and the portfolio variation over the periods under analysis.
It is also known that the returns of the various asset classes are correlated, that is, shares often move in the same direction as bonds. For this reason, it is also more correct to use the geometric return.
CAGR vs AARG
CAGR and AARG are two measures to calculate the annual return of a portfolio and derive from the aforementioned methods, namely the return based on the arithmetic average and the return on the geometric average.
The arithmetic average return of the annual portfolio is a simple average of periodic returns and does not include the effects of compound capitalization or the effects of the volatility involved in the investment, such as the variation in the price of assets and in the portfolio itself over time.
If we use this method to calculate the annual return, then it means that we are calculating the AARG, ie Average Annual Growth Rate. This growth rate is useful in detecting very long-term trends.
The term CAGR stands for Compounded Annual Growth Rate or effective annual rate of return. Thus, it is a rate of return that takes into account the capitalization effect, smoothes returns and reduces the impact of volatility in the calculation of periodic returns.
Both CAGR and AARG are measures of annualized return, essential for comparison and analysis purposes, but they are not the same and the results, as we have seen in the example above, can be quite different.
When reviewing investment proposals or specific financial instruments, pay attention to how past return or expected return is presented. As you have seen in this and other articles about the return, the results are quite different and can be misleading.
Read also:
- How is the return on investment calculated;
- The time weighted rate of return and the amount invested;
- Other factors in the return analysis: leverage, inflation, costs and taxes.
Queremos a ajudá-lo a ser melhor investidor e atingir os seus objetivos:
We want to help you be a better investor and achieve your goals:
- We help you develop your Investment Policy Statement;
- We develop individual or group training on investments and savings;
- We quantitatively analyze your current portfolio with Future Analyzer's computational technology and finances;
- Request more information about the investment advisory service provided through Banco Invest.

Vítor is a CFA® charterholder, entrepreneur, music lover and with a dream of building a true investment and financial planning ecosystem at the service of families and organizations.
+351 939873441 (Vítor Mário Ribeiro, CFA)
+351 938438594 (Luís Silva)
Future Proof is an Appointed Representative of Banco Invest, S.A.. It is registered at CMVM.