The formulation of expectations for the investment portfolio
The definition of the investment strategy for the investment portfolio is the result of the investment policy and the formulation of expectations for the capital market.
It is an iterative process that culminates in portfolio optimization, asset selection, and strategy execution.
Throughout these articles on expectations for financial markets, we describe the main differences between economics and markets, define the main indicators, the importance of asset classes and the various layers and combinations between the various classes in terms of geography, sector, industry, style or trend.
But we know that at the macroeconomic level forecasts are just that: forecasts. And when we look at exchange rates, market interest rates, inflation or even the unemployment rate, we should know how unpredictable these indicators are.
Therefore, the magical corollary of this reflection leads us to the objective of this work. We don't want to predict the next recession or the unemployment rate a year from now. We want to build a mosaic of dynamic information, aimed at investors and allowing us to build a portfolio aligned with their goals and preferences.
Investor description and framework
Let's take as an example a concrete case of an investor who defines the investment policy as follows, summarized:
- Do-it-yourself investor - uses advising to prepare the investment policy, to formulate expectations for the capital markets, to optimize the asset allocation strategy and for rebalancing and monitoring;
- It intends to build a portfolio with the objective of maintaining a standard of living in retirement;
- Time horizon 20 years;
- Annual reinforcements and rebalancing;
- Real return required goal to reach your goal – 3% (in this podcast episode we explain the difference between real and nominal return);
- It has liquidity and an emergency fund worth 1 year of family expenses;
- Family of 4 - 2 adults and 2 children (10 and 12 years old);
- Other goals and time horizon – savings for children's education, over a period of 10 years);
- Ability to save 20% of available annual income;
- Various sources of income, including 2 leased properties;
- Risk tolerance (in more detail here):
- Moderate or above average capacity (various sources of income, high HT, saving capacity and good health status;
- Willingness to take risk is moderate – Maximum portfolio decline 95% of the time less than 15% in each 12-month period, volatility between 6% and 10%.
It looks at a portfolio composed of the major asset classes equities, bonds and liquidity. It has no other restrictions or special circumstances at the regulatory or fiscal level.
Process for formulating expectations
From this framework we know that we need data for the selected asset classes. These data encompass various performance indices and metrics with a broad time span, exceeding 20 years. We analyze history to understand behaviors and risks, extreme events, and economic and political cycles.
We use methods available on the market such as opinion panels, surveys and statistical methods, simulations, financial methods and data analysis. We combine demographic, economic, performance, social, financial, macroeconomic and liquidity indicators.
As sources of information we selected management companies, central banks, governmental and supranational bodies and other institutions.
Among the various sources used are: ECB, OECD, IMF, BIS, BOJ, BOE, FRED, FED, Eurostat. In addition to various financial and economic information websites and portals such as Yahoo finance, investing, Trading Economics, Damodaran, Shiller, Yardeni Research, Financial Times, Bloomberg, Reuters, among others.
With this concrete example we want to demonstrate the careful and personalized process that asset selection constitutes.
The outlooks that various investment banks and management companies develop and periodically update are useful tools. In addition to analyzing different asset classes, they produce analysis and insights that mark the evolution of the market. They also present contradictory views important to avoid complacency.
However, they are not tailored to a specific investor. They do not analyze the asset classes as intended by the investor, they do not have the same time horizon, nor the investor's specific circumstances. And they are often oriented towards the sell-side, that is, with commercial intent and oriented towards the financial products marketed by the institution.
Thus, these outlooks should be a complement and not the main vehicle for building the optimized and personalized portfolio.
Ferramentas e modelos utilizados
Among the information normally presented in these outlooks, the treasury bond yield curve, its time structure (the yield curve), market multiples (such as the price-to-earnings ratio), risk premiums ( ERP – equity risk premium), government and corporate bond yields, credit spreads, sentiment and confidence indicators and indicators such as PMI (Purchasing Managers' Index).
Of these, one of the most explored is the price-to-earnings (P/E) ratio, in its historical version (last 12 months of results) or in its advanced version (next 12 months of results). There is also the version developed by Robert Shiller, CAPE.
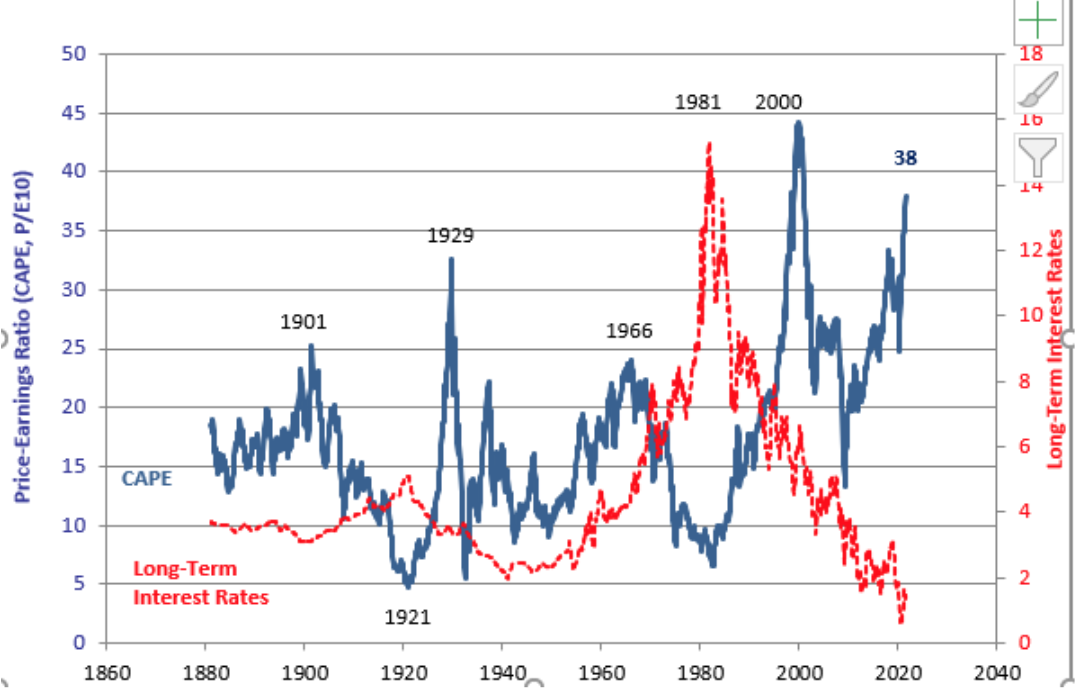
Source: Econ.Yale.Edu
In recent decades, we have had a strong expansion of the P/E multiple (related to lower inflation and interest rates). Determining the most important component of the expected return of the market implies, according to the Grinold-Kroner model, dividing the expected return into three components:
- Income (dividends and buybacks)
- Growth of results in nominal terms
- Repricing, via expansion of the P/E multiple
The result of this process means formulating expectations for the financial market in accordance with the investment policy. And an example of this result can be seen in Vanguard's semi-annually revised annual Outlook. The review published in July 2021 has the following expectations:
- U.S. stocks: 2.4% to 4.4%; Ex-U.S. stocks: 5.2% to 7.2%.
- U.S. bonds: 1.4% to 2.4%; Ex-U.S. bonds: 1.3% to 2.3% when hedged in U.S. dollars.
- Euro-area stocks: 2.9% to 4.9%; Ex-euro-area stocks: 1.6% to 3.6%.
- Euro-area bonds: –0.5% to 0.5%; Ex-euro-area bonds: –0.5% to 0.5% when hedged in euros.
- Chinese stocks: 5.1% to 7.1%; Ex-China stocks: 3.6% to 5.6%.
- Chinese bonds: 2.8% to 3.8%.
These estimated returns are annual, nominal and for the next decade and reflect the opinion and process defined by the company itself.
Monitoring and follow-up
The monitoring process is ongoing. It can be changed in the case of extraordinary events and also in moments of reinforcement or changes in the investment policy and investor characteristics, which may or may not coincide with the rebalancing of the portfolio. Rebalancing allows keeping the portfolio in line with the weights defined for each asset class in the investor's investment policy.
This model allows investors to be less sensitive to market variations. And at some point we even asked: Is it essential to predict when the next recession will be? Should we form expectations taking into account the portfolio?
The truth is that even assuming assumptions and a plan, unpredictable events happen. One that nobody really expected. External shocks happen. Although they are not predictable they should be expected. Just remember the oil shock, the 2007-2009 financial crisis, the COVID-19 pandemic crisis or even a war.
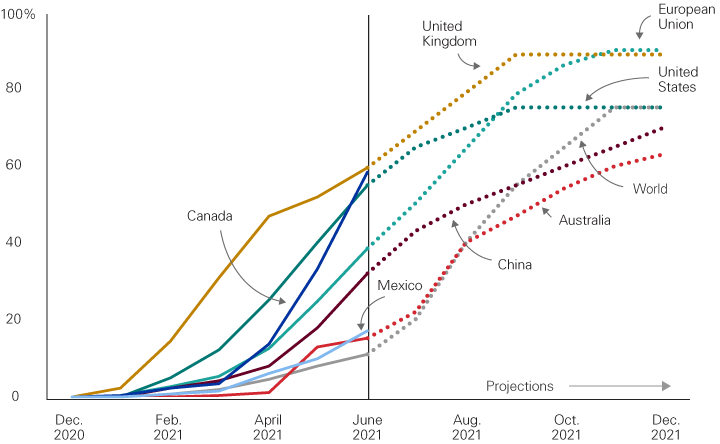
Let's look at the concrete case of COVID-19. Economic growth is expected to be higher in countries/regions where vaccination is more advanced and where fiscal/budgetary support has been higher.
In this scenario, will developed markets prevail?
In these moments of extreme events we give up on our plan. And we just want to go back to thinking about markets when the economy stabilizes or is already growing. The problem is that market timing is very difficult and we will never know the right time to exit and the right time to enter. And we make mistakes that can do even more damage than a crisis.
To be successful investors we don't need to ping-pong the market, guessing when to exit and enter. It is a long-term process in which we must use diversification and rebalancing, weighted with our savings capacity and risk tolerance.
This all seems too complex and out of reach for most people
It shouldn't be like that. In the long term, the market information mosaic tends to be less important in the portfolio's evolution, with our own contribution standing out. And that contribution comes in the form of saving capacity, time and optimism.
We must focus on what we can control, always keeping saving as a priority. It is the staple food in the wallet that will lead us to achieving our goals. Then optimism. Basically, to believe that in the future the world will be better, more developed and with increasing wealth.
In this simpler but not simplistic perspective, market expectations become an important factor for rebalancing and monitoring tasks and not so much for the long-term investment strategy.
This is not to downplay the importance of this tool. On the contrary. We only emphasize the importance of the factors of time (patience), savings and optimism as central elements to build and develop our portfolio. In the long run, it won't be as important to predict the next recession or when interest rates will rise. It is more important to understand if we are going to keep the pace of savings and adjust the portfolio to our real needs.

Vítor is a CFA® charterholder, entrepreneur, music lover and with a dream of building a true investment and financial planning ecosystem at the service of families and organizations.
+351 939873441 (Vítor Mário Ribeiro, CFA)
+351 938438594 (Luís Silva)
Future Proof is an Appointed Representative of Banco Invest, S.A.. It is registered at CMVM.