Is the S&P 500 being dominated by 5 listed companies?
This year we've been hearing a lot about how much 5 companies, which represent about 20% of the capitalization of the S&P 500, have contributed to the rise of the index and that would be the main reason for the disconnect between the recent rise of the S&P and the "real economy" ".
The 5 companies are, in order of market capitalization:
- Microsoft 5.96%
- Apple 5.83%
- Amazon 4.53%
- Alphabet 3.35%
- Facebook 2.22%
In this article I will analyze the impact of these 5 mega companies as a reason for the recent performance of the S&P. Of these 5 quoted only Alphabet has a value below the February quote (time when the S&P 500 made maximums).
I will use a version of the S&P 500 where the "excessive" weights of these actions are limited. In this case the S&P 500 Equal Weight. The S&P 500 Equal Weight (S&P 500 EW going forward) is an index with a different weighting calculation methodology from the "normal" S&P 500/Capitalization Weighted (S&P 500 going forward).
The S&P 500 is an index where the weight of each component is represented by the company's market capitalization. It is thus expected that Apple has a higher weight than most other companies, reflecting the size that this multinational has.
On the other hand, in an Equal Weight index, all shares have the same weight when rebalancing, which in the case of the S&P 500 EW is quarterly. Thus, we can see large companies like the 5 mentioned above having similar weights to other companies with much smaller market capitalization, such as Under Armor or GAP, both with a weight around ronda0.01% of the S&P 500.
Fortunately, not only do these indices exist, but we also have ETFs that have been following them for several years:
- S&P 500 - SPY;
- S&P 500 Equal Weighted - RSP.
The weights in the RSP of the 5 companies mentioned above are:
- Microsoft 0.22%;
- 0.22% Apple;
- Amazon 0.22%;
- Alphabet 0.2%;
- Facebook 0.19%.
By not making these companies disappear, the RSP ends up being able to meet the criticism that the S&P 500 CW is dominated by 5 companies and we can thus see their contribution.
Let's start with a simple YTD (2020) comparison of SPY and RSP.
Performance table since the beginning of the year
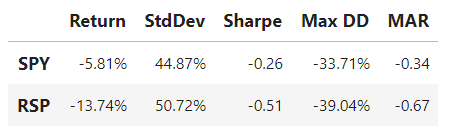
We can see that the criticism has some basis, with the S&P 500 posting a much lower fall than the RSP. SPY shows -5.8% YTD vs -13.7% YTD of RSP. An 8 percentage point spread over 6 months is significant. Earlier this month the differential was, however, only around 2.5 points. It seems to us that there is a very high volatility with regard to the spread between both ETFs.
Below we can see a graph showing the overperformance of the SPY against the RSP, ie, very briefly, how much the RSP would have to go up to "catch" the SPY. We conclude that SPY has not only always performed better than RSP this year, but with the exception of a drop in early June, the overperformance has been significant.
The truth is that, coincidentally, the stocks that rose (or fell less) in this crisis were already the stocks with the highest market capitalization of the S&P 500 at the end of 2019. We can also see in a recent infographic by Visual Capitalist that the entire technology sector information is having an excellent performance in 2020 (of the top 5 only Microsoft and Apple are part of this sector).
Although the S&P 500 has benefited from the good performance of these 5 mega companies it is not completely true that most other companies have not risen. By early June, 99% of the S&P 500 companies had quoted above the average of the last 50 days, as can be seen from barcharts.
Is this concentration abnormal?
Now that we have seen that in fact the S&P 500 is benefiting from the good performance of the 5 listed companies with the highest market capitalization, we should ask ourselves to what extent is this a normal situation? If we think 20% too much, we must have a reference value of what is "normal" to make this judgment.
As you can see from this excellent Dimensional article, this level of concentration has historically not been abnormal. It seems like we've simply gone back to "the old normal".
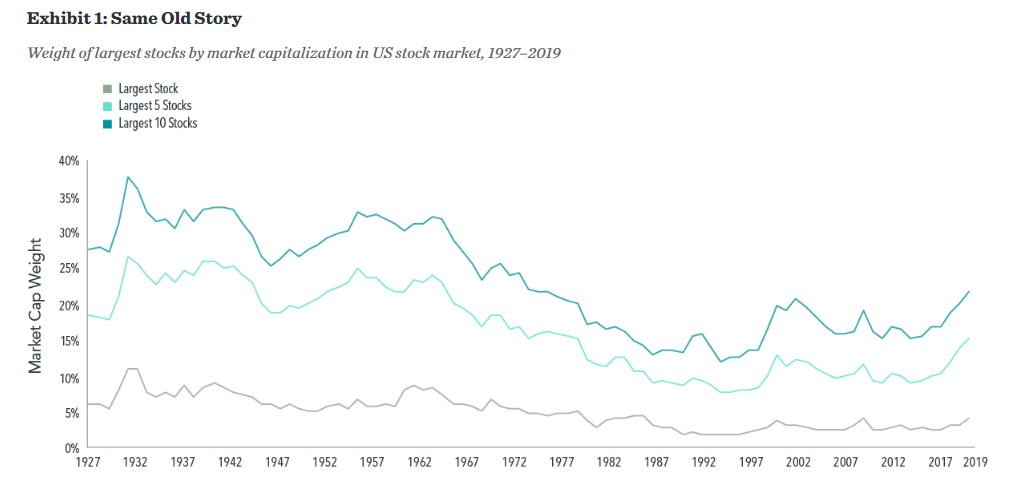
Source: Dimensional

With a degree in economics (2006) and a postgraduate degree in Finance from Universidade Católica do Porto (2010), he later realized that he shared the same enthusiasm for programming.
+351 939873441 (Vítor Mário Ribeiro, CFA)
+351 938438594 (Luís Silva)
Future Proof is an Appointed Representative of Banco Invest, S.A.. It is registered at CMVM.