What is the bond market telling us
In a time as troubled and different as the one we live in, the signals that the market is transmitting tend to be dubious and often dramatic.
In the case of the bond market, the situation is no different. Volatility is historically high and if at an initial moment there was a flight to lower risk assets (formerly riskless assets), such as bunds (German bonds) or treasuries (American bonds) in recent days the situation has changed.
In fact, there was an impressive shift in yields along the interest rate curve. The flight to these assets led to a sharp fall in yields at first, until March 9, 2020. This was followed by a significant increase in yields in recent days.
The reddish line represents the yield curve (yield curve) of government bonds rated AAA in the euro area on 03.09.2020 and the blue line the same yield curve on 03.17.2020.
The situation is somewhat different in American treasuries. The slope of the curve was also accentuated, but there was, in the same period, a drop in yields on shorter maturities and an increase in yields on longer maturities.
Data taken here for the treasuries yield curve and here for the euro area yield curve.
Despite being very recent data and based on large doses of volatility, it is clear that the slope of the curve has accentuated.
We currently have an extremely aggressive monetary policy. Central banks, after the 2008-2009 financial crisis and the European crisis that followed, maintained more or less aggressive expansionist policies, which caused a sharp drop in interest rates and, consequently, in the yields of government bonds to negative values. The Fed, which was already in a less expansionist phase, changed course drastically. So much so that it lowered interest by 1 p.p. to 0%-0.25% last Sunday.
But there is a new fact that has to do with the fiscal and budgetary policy of central governments.
The theoretical relationship between fiscal policy (governments), monetary policy (central banks) and the yield curve indicates that when both policies are in expansionary mode, the yield curve presents an upward slope (upward sloping).
A rise in the interest rate on long-term bonds (30 years) is also seen as an indicator of expectations for the future of interest rates and even economic growth. That is, higher long-term interest rates are an indicator of long-term economic growth (perpetuity).
And in fact, from a budgetary point of view, we have seen several announcements of strong measures to support families and companies that will necessarily increase each country's deficits and force more debt issues.
On the other hand, a rise in the interest rate on long-term bonds (30 years) is also seen as an indicator of expectations for the future of interest rates and even economic growth. That is, higher long-term interest rates (30 years) are an indicator of long-term economic growth (perpetuity)
The bond yield curve as a leading indicator
Admittedly, the government bond market yield curve has long been seen as an important indicator of the state of the economy. In particular, it is seen as a leading indicator, that is, an indicator that anticipates economic conditions within 6 to 12 months.
One of the problems with these indicators is the false signals. In August 2019, by the way, we had what many classified as a false signal – a reversal of the yield curve. According to data consulted by the Federal Reserve Bank of St. Louis, here, the difference between the yield on 10-year and 3-month US bonds was negative: -0.49%.
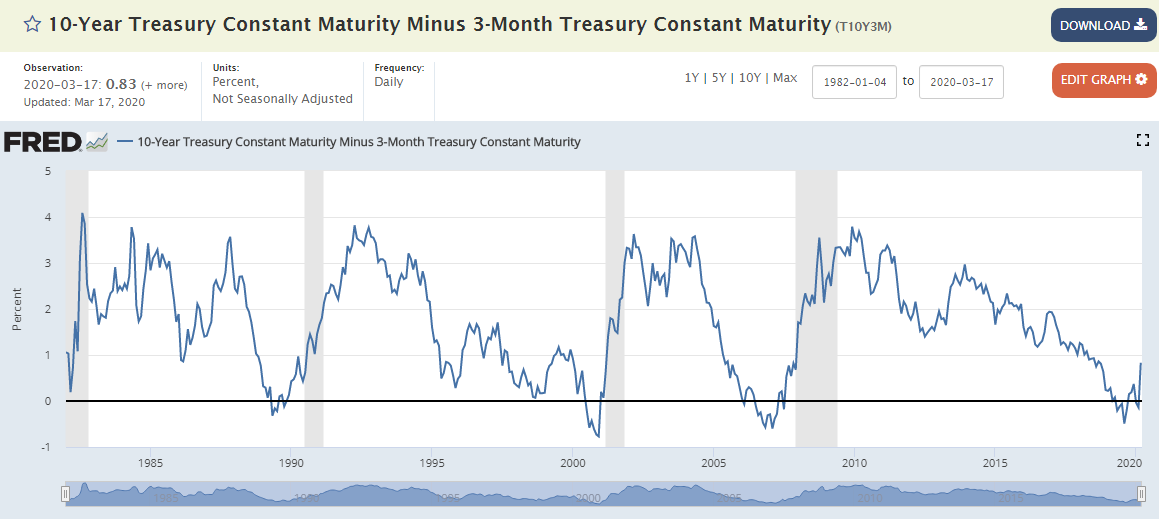
In historical terms, this indicator anticipated several economic downturns.
And if in August of last year a recession seemed to us to be a false positive, right now it may be difficult to avoid.
Transposing to the European economy and the yield curve of the European Union, the euro area, the situation in terms of monetary and fiscal policy is similar - despite the various speeds of the European economies.
Long-term interest rates soared - more in countries with higher debt and lower growth.
There is a clear shift in the curve, with greater amplitude in the intermediate terms, but also in the short and long term.
There is also a clear increase in the perception of risk in countries with higher debt and weaker economic growth such as Italy, Spain, Portugal and Greece. But, in general, medium and long-term yields are on the rise, which seems to me to be a consensus regarding a fiscal policy far from austerity and the need to do whatever is necessary to avoid an economic collapse.
Note: at the time of writing this article, the ECB has just launched a very strong program of massive purchase of European government and corporate debt…which will provoke another abrupt movement in the yield curve.

Vítor is a CFA® charterholder, entrepreneur, music lover and with a dream of building a true investment and financial planning ecosystem at the service of families and organizations.
+351 939873441 (Vítor Mário Ribeiro, CFA)
+351 938438594 (Luís Silva)
Future Proof is an Appointed Representative of Banco Invest, S.A.. It is registered at CMVM.