Returns and time - a long-term relationship
I decided to continue with the analysis of investment and crises from a temporal point of view. With this post the idea is to complement what I already wrote in the previous article, "The day you wanted to sell everything".
I intend to introduce the concept of rolling returns in the analysis. In this particular case, 10-year rolling returns. We usually think of returns as something static, how much has been earned in the last 3, 5 or 10 years. Now imagine a continuous line where these results are continuously added up to a graph of profitability over certain periods of time.
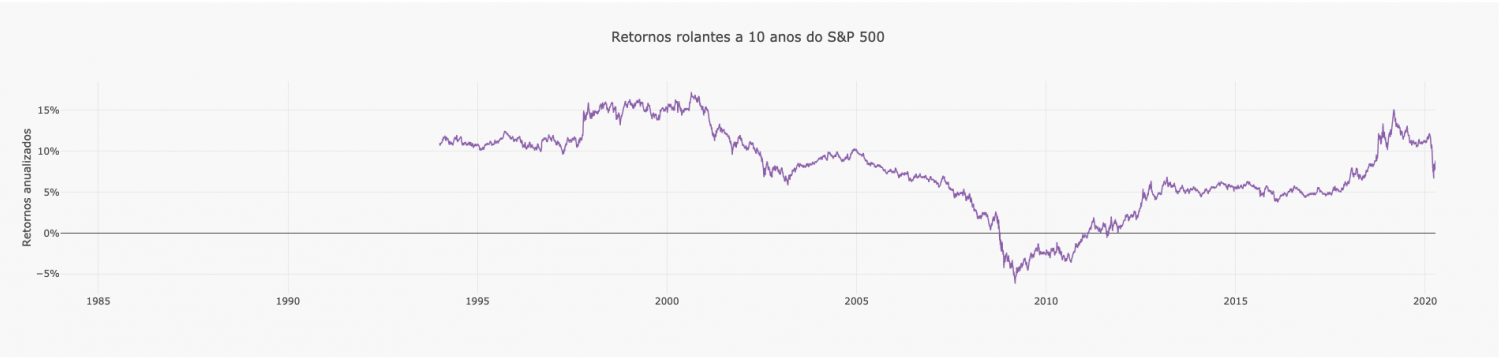
I'll illustrate it visually - after all, a picture is worth 1000 words. I used the S&P 500, as in the previous article, but with a longer time frame, from the beginning of 1984 to the present day. Why 10 years earlier? Because to know the 10-year return in 1994-01-01, the investor would have had to have initially invested in 1984-01-01.
The 10-year rolling returns chart is:
Note: The graphics in this article, if viewed on PC, are interactive. You can zoom if you want. Just click and drag the mouse (holding the click)
As expected, the first 10 years have no returns since, as mentioned above, only in 1994 do we have the 10-year returns of those who invested in 1984. Analyzing returns in this way gives rise to interesting observations. We can see in 1997 the positive impact on 10-year returns when the 1987 crash came out of the 10-year "window". Returns jumped from 11.9% to 16% in just 4 sessions. Or we can see something similar between October 2017 and March 2019, because 10 years earlier it was the Great Recession.
But what's the point in showing 10-year returns and what does that have to do with the current crisis? In the previous article I stated that in terms of data for long-term investments this crisis has had a (so far) much less pronounced impact, and this can be seen in this graph of returns perfectly, for two different reasons.
First, and what comes out right away is that the 10-year return seems to be somewhere in the middle of the graph, it doesn't look too low or too high. It is even slightly above mid-decade values. Not bad for a crisis that had the fastest entry into the bear market ever.
Second, we can see that between October 2008 and February 2011 the 10-year return of the S&P 500 was ALWAYS negative. Can you imagine yourself at the end of 2008 with your investments with negative returns after 10 years and still see the market making new lows in February/March 2009?
It is on this second point that I intend to focus, and the difference between that and the current situation. We all know that the fall was strong and fast. We can see this drop in 10-year yields, having dropped from 12.1% to 6.7% in about 1 month. We don't know if the falls will continue, we just can and must make decisions with the data we have and the reality we live. And the truth is that we are currently, in terms of long-term profitability, much better off than at the time of the Great Recession of 2008.
GitHub: Returns and time – a long-term relationship

With a degree in economics (2006) and a postgraduate degree in Finance from Universidade Católica do Porto (2010), he later realized that he shared the same enthusiasm for programming.
+351 939873441 (Vítor Mário Ribeiro, CFA)
+351 938438594 (Luís Silva)
Future Proof is an Appointed Representative of Banco Invest, S.A.. It is registered at CMVM.